It Moved! Early Pitching Velocity Surgers

 Pitching in baseball is a complex undertaking—a subject comprised of part art, part science. There are many interconnected variables—pitching mix, velocity, sequencing, deception, movement, control, command, game plan, framing, umpiring—many of which are difficult to quantify, making it nearly impossible to fully understand pitching performance and predict its impact on the future.
However, there are still some things we think we know! For instance, last week we discussed that each tick of velocity is worth roughly 0.25 in ERA for starters and 0.40-0.45 in ERA for relievers. In that same piece, we highlighted the early decliners because fastball velocity becomes meaningful in as quickly as 10 fastballs.
This time we’ll be looking at early velocity surgers—those that have seen their velocity increase since last season—keeping in mind that cold weather and early season ramp-up tend to suppress velocity. Many pitchers will likely gain roughly one tick as the season goes on, peaking in August.
For our purposes this means that even “neutral” early-season velocity could indicate that pitcher might be up a tick on the season. Let’s take a look. (Data as of 4/29/18)
Biggest Surgers—Starters
Top 15 Surgers – Starting Pitchers
| # | Name | IP | Fastballs | FBv_18 | FBv_17 | Diff |
| 1 | Daniel Gossett | 7.1 | 83 | 92.8 | 91.5 | 1.3 |
| 2 | Kyle Hendricks | 29 | 309 | 86.8 | 85.8 | 1.0 |
| 3 | Charlie Morton | 29 | 268 | 96 | 95 | 1.0 |
| 4 | Blake Snell | 35.2 | 338 | 95.1 | 94.3 | 0.8 |
| 5 | Mike Foltynewicz | 32 | 336 | 96.1 | 95.3 | 0.8 |
| 6 | Junior Guerra | 22 | 247 | 92.5 | 91.9 | 0.6 |
| 7 | Andrew Triggs | 23 | 202 | 89.5 | 88.9 | 0.6 |
| 8 | Kenta Maeda | 20.1 | 161 | 92 | 91.5 | 0.5 |
| 9 | Brent Suter | 30.1 | 323 | 86.2 | 85.8 | 0.4 |
| 10 | Dallas Keuchel | 36 | 337 | 89.1 | 88.7 | 0.4 |
| 11 | Jake Arrieta | 24.2 | 250 | 92.4 | 92.1 | 0.3 |
| 12 | Lance Lynn | 18.2 | 309 | 92.1 | 91.8 | 0.3 |
| 13 | Vince Velasquez | 26 | 286 | 94.2 | 93.9 | 0.3 |
| 14 | J.A. Happ | 29 | 356 | 92 | 91.8 | 0.2 |
| 15 | Trevor Cahill | 12 | 83 | 91.1 | 90.9 | 0.2 |
Kyle Hendricks has been channeling his inner Jered Weaver, but slightly less so this season. Hendricks has always relied on command more than velocity, but at least his velo isn’t continuing to trend in the wrong direction. Even so, I’m not totally buying his 3.10 ERA. His FIP and SIERA currently sit at 4.70 and 3.88, respectively. And he’s not inducing as many swings on pitches outside of the zone while allowing more contact on pitches inside the zone.
Additionally, he’s developed a bit of a home run problem so far (1.55 HR/9), though to be fair, xStats indicates he should be closer to 1.1 xHR/9. Putting it all together, Hendricks has a profile that tends to consistently beat his ERA indicators, so there’s precedent here. Still, it’s not a profile I’m actively buying beyond his Steamer ROS projections of 3.90 ERA.
Somehow Charlie Morton has added another velocity increase to his belt, increasing from 93 earlier in his career to 96 in the early going this season! He appears to be the real deal—aided in our rotisserie games by increased win chances as a result of playing for one of the best teams in baseball. His strikeout rate is up to 29% and his groundball rate is up to 59%.
His 3.91 FIP and 3.19 SIERA aren’t buying the 1.86 ERA—not that anyone should be on a number that low—but those numbers might be discounting his bad home run luck. He’s seen 22.2% of flyballs leave the yard, resulting in a 1.24 HR/9—while xStats suggests that should be much lower (0.4 xHR/9). I’m buying Morton’s strikeout and groundball gains, but it should be noted that his innings career-high is 171 innings pitched back in 2011 with the Pirates (his innings from 2012-2017 have been 50, 116, 157, 129, 146). His price has probably skyrocketed since draft day, but he could be worth an inquiry in case his owner sees this as a sell high opportunity. I’d be buying.
Blake Snell has parlayed his increased velocity into a higher swinging strike rate (from 10.8% to 13.8%) and a strikeout rate nearing 30%—doubling his K-BB% in the process from 11% last season to 22% this season. His 2.90 FIP and 3.29 SIERA back up his early 2.52 ERA. Expect a little home run regression from his current 0.76 HR/9 (xStats suggests it should be 0.9 xHR/9), but with the improved strikeout and walk rates and increased velo, I’m buying and will take the under on his ROS projections (3.50-3.70 ERA).
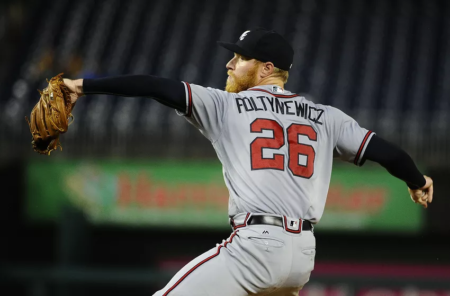
Mike Foltynewicz has always been a bit of a tease, flashing plus velocity but not delivering commensurate results. This year has been a bit different with Folty, the owner of a shiny 2.53 ERA so far. That’s good! I can’t say I’m totally buying him—and certainly not the 2.53 ERA—but there are a few things going well. He has always had plus velocity, but the extra tick is nice and his strikeout rate is up from 20.7% to 29.3%. He has relied less on the sinker and more on the changeup this year, giving batters different looks and a more complete arsenal. He’s also inducing less contact both inside and outside of the zone.
HOWEVAH (Stephen A. Smith voice)… he’s also inducing fewer swings both inside and outside the zone, which may be driving his walk rate up from 8.5% to 11.3%. Even so, Folty’s owners are playing with house money right now as he didn’t cost much on draft day. While ROS projections aren’t crazy about him (4.30-4.80 ERA, 1.30-1.40 WHIP), I’m taking the under on those amid his 18% K-BB%, 3.87 FIP, 3.70 SIERA, and 0.7 xHR/9 (against an actual 1.13 HR/9).
Junior Guerra flashed brief relevance back in 2016 when he ran a 2.81 ERA, 3.71 FIP, 4.42 SIERA, 1.13 WHIP, and 11.6% K-BB%. After an injury-riddled 2017, his velocity is back up closer to the 94 we saw in 2016, and his K-BB% is up to 15%. He’s pounding the zone right now and inducing fewer swinging strikes than last season so I’m hesitant to fully buy the 23% strikeout rate. But he could be a useful pitcher—probably closer to his 4.05 SIERA than his 2.77 FIP, but better than his ROS projections (4.60-5.00 ERA, 1.40-1.50 WHIP).
Andrew Triggs has likely been better than his 4.70 ERA suggests, holding a 14% K-BB%, 3.75 FIP and 3.97 SIERA. His GB% is also up to 53% this season and combined with his spacious home park, he profiles as a useful back-of-the-rotation fantasy arm.
Kenta Maeda will always be a casualty of the Dodgers’ creative rotation-ing, as he’s currently on pace for roughly 120-130 innings—similar to the 134 innings he threw last season. In the innings he has pitched this season, though, he’s been (mostly) straight fire. He currently holds a 33.7% strikeout rate and 6.5% walk rate, resulting in a pristine 27.2% K-BB%, good for 7th among pitchers with at least 20 innings.
One thing to note is that, while homers haven’t been a problem, his WHIP is a ghastly 1.48, although its likely driven by a crazy .434 BABIP. His 1.80 FIP and 2.64 SIERA are clearly regressing that closer to a league average of roughly .300, but I find it curious that his exit velocity allowed has jumped from 85.4 to 90.2 MPH this season. I’d like to bet on his elite strikeouts and walks thus far, but his lower innings ceiling and higher exit velo allowed is giving me a bit of pause, and certainly worth watching. Overall, this is a profile to like—ROS projections suggest a 3.40-3.70 ERA and 1.16-1.20 WHIP. But pump the brakes due to lack of volume.
The rest of these surgers have seen velocity increase by only 0.4 or less. Given that velocity increases as the season goes on, it’s a good sign to see them up early in the season—all but guaranteeing they won’t see a season-over-season velocity drop, assuming they avoid injury. Each is worth looking into given they could, in theory, be up at least one tick on the year.
One name that I’m particularly interested in is Trevor Cahill. He looked like a very good pitcher early last season with the Padres before an oblique injury put him on the DL and he was traded to the Royals. He wasn’t the same after, but now he calls Oakland home. Given his low cost, I’ll buy his early 30.4% strikeout rate (just 12 innings) and see where he takes me.
Biggest Surgers—Relievers
Top 15 Surgers – Relief Pitchers
| # | Name | IP | Fastballs | FBv_18 | FBv_17 | Diff |
| 1 | Amir Garrett | 14.2 | 123 | 94.1 | 91.7 | 2.4 |
| 2 | Seth Lugo | 14.1 | 118 | 93 | 91.1 | 1.9 |
| 3 | Collin McHugh | 10.2 | 91 | 91.9 | 90.2 | 1.7 |
| 4 | Tyler Glasnow | 15.1 | 210 | 95.7 | 94.6 | 1.1 |
| 5 | Roberto Osuna | 11.1 | 113 | 95.4 | 94.6 | 0.8 |
| 6 | Robert Gsellman | 14 | 122 | 93.5 | 92.7 | 0.8 |
| 7 | Miguel Castro | 16.1 | 139 | 96.2 | 95.6 | 0.6 |
| 8 | Oliver Drake | 12.2 | 122 | 92.5 | 91.9 | 0.6 |
| 9 | Brad Peacock | 12.2 | 113 | 92.6 | 92.1 | 0.5 |
| 10 | Tony Barnette | 2.2 | 27 | 93.4 | 92.9 | 0.5 |
| 11 | Jordan Lyles | 16.1 | 108 | 94.3 | 93.8 | 0.5 |
| 12 | Bud Norris | 13.1 | 114 | 94.5 | 94.1 | 0.4 |
| 13 | Austin Pruitt | 14.2 | 97 | 92 | 91.6 | 0.4 |
| 14 | John Brebbia | 5 | 43 | 94.6 | 94.2 | 0.4 |
| 15 | Matt Andriese | 13.1 | 106 | 92.4 | 92.1 | 0.3 |
Five of the first six on the list are to be expected—all (except Osuna) have moved from the rotation to the bullpen so far this season. Roberto Osuna is an interesting name on the list, as the added velocity could take him from being a second-tier to elite closer, particularly with Kenley Jansen and Craig Kimbrel appearing mortal (and showing on last week’s decliner’s article).
Bud Norris has been amazing this season, like Cahill above, re-capturing some of his early-season magic from last season. While I don’t believe he’ll retain the closing job—the Cardinals invested $14M in Greg Holland to close—he might be an elite guy in saves plus holds leagues, with a 38.5% strikeout rate and 3.9% walk rate. If Holland continues to falter, Norris could accumulate saves longer than expected.
Wrapping Up
Going back to our introductory piece on which stats to look at early in the season, we’ve concluded our looks at pitcher fastball velocity, which become meaningful very quickly.
In the pieces to come, we’ll look at other interesting trends that have become meaningful early in the season, such as pitcher’s arsenals and hitter’s exit velocities. Stay tuned!