Expected Strikeouts: Who Is Under- and Over-Performing?
 I was crammed into a middle seat on a recent flight to Seattle and I decided to spend the $10 for WiFi so I could pass the time by reading some baseball content about plate discipline metrics for pitchers. It was Chaz Steinberg’s article exploring their impact on strikeouts and walks.
This got me thinking a couple of things. First, the best predictors of pitcher performance we have are strikeouts, walks and home runs. In the Statcast era, you might even be able to think of home runs as quality of contact allowed, as measured by exit velocity.
Still, we must be careful with contact as there are many factors that allow hits, some of which are beyond a pitcher’s control. Conversely, pitchers control strikeouts, walks and their ability to keep the ball in the yard.
Second, based on our look at statistics to prioritize early in the season, we know that strikeouts are among the first to become meaningful, “stabilizing” in as few as 60 PA. That got me thinking: if strikeouts stabilize after 60 PA, then some of its components parts, such as pitch- and swing-level stats, should stabilize even faster.
While strikeouts are meaningful right now, perhaps we can get a better view of what a pitcher’s strikeout rate should be based on these component parts: swinging strike rate (SwStr%), contact rate (contact %) and swings induced outside of the strike zone (O-Swing%). Think of this as a shorthand to expected K%.
I recommend reading Chaz’s piece or FanGraphs glossary for more info on each of those, but for now, all you need to know is how each of these correlate to strikeouts.
Here’s a quick summary of the three stats, courtesy of FanGraphs:
- SwStr% = Swings and misses / Total pitches
- Contact% = Number of pitches on which contact was made / Swings
- O-Swing% = Swings at pitches outside the zone / pitches outside the zone
Given that pitches and swings rack up more quickly than plate appearances, you can see why these metrics could potentially be more useful to look at, particularly earlier in the season.
Now, what do they all mean in relation to a pitcher’s strikeout rate? The following are r-squared calculations are courtesy of Chaz, using 2015-2017 data for all qualified pitchers:
| Metric | R-Squared |
| SwStr% | 0.76 |
| Contact% | 0.75 |
| O-Swing% | 0.23 |
First, a quick primer on r-squared: r-squared is a measure of how closely data fits a regression line. In simpler terms, it describes how strongly two variables are correlated. An r-squared of zero suggests that the variable explains 0% of the variability, whereas an r-squared of one suggests that the variable explains all of the variability. For our purposes, the larger the r-squared, the better indicator it is to explain the relationship at hand—in this case, these metrics are trying to help us better understand what a pitcher’s “true” strikeout rate should potentially be.
The fact that these metrics correlate relatively strongly with strikeouts are fairly intuitive. The more swings and misses a pitcher induces, the more strikeouts are likely to come. Similarly, the less contact a pitcher allows, the more strikeouts are likely to come. Lastly, the more swings a pitcher induces on pitches outside the strike zone, the less likely hitters will be able to make contact and more likely more strikeouts will ensue.
Additionally, it appears SwStr% and Contact% have a roughly three times stronger relationship with strikeouts as O-Swing% does. I’ll use these three metrics to evaluate a pitcher’s ability to generate strikeouts—weighting SwStr% and Contact% three times more than O-Swing%.
There are more factors to consider—such as command, called strikes and so on—but the idea here is to create a quality proxy for pitchers who should be striking out more batters and pitchers who should see regression in their current strikeout rate.
A quick note on the sausage-making: To do this, I’ve pulled 127 starting pitchers with at least 20 innings pitched to date and assigned z-scores to their SwStr%, Contact% and O-Swing%—basically looking at how many standard deviations above the mean they’ve performed. I’ve added those z-scores to create a single metric, weighting SwStr% and Contact% three times more than O-Swing%. I then created a rank for this z-score and each pitchers current K% and then compared the two—sorting for the biggest differences in both directions. I’ll paste the entire raw list below, but will touch on a few that stood out to me.
Potential Under-performers
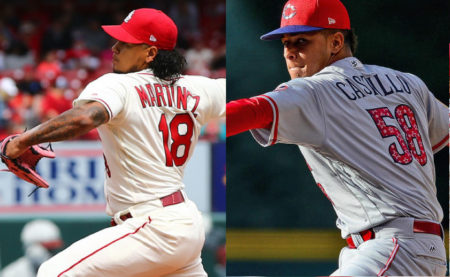
Luis Castillo ranks as the greatest negative difference between his actual K% and this weighted metric, ranking 21st in the weighted metric but only 94th in actual K%. Plenty of ink (virtual and traditional) has been spilled writing about Castillo’s poor start.
Andrew Perpetua thinks his decreased spin rate might suggest imminent injury. Eno Sarris ($) sees greater drop in his pitches and thinks he might be tinkering—and he’s currently buying. Nick Pollock is worried about the decrease in fastball velocity. Pollock and Paul Sporer are both taking the “L” on Castillo as of now, having touted him heavily throughout draft season, but will be watching closely and be ready to jump back in at a moment’s notice.
All I know is he has a SwStr% (13.5%) and Contact% (71%) that are each 1.2 standard deviations (SDs) above the mean and an O-Swing% (31.5%) 0.6 SDs above the mean. All of this to say, he’s showing signs of underperforming his 18.3% K%. Strikeouts aren’t everything, but the reality is his strikeout rate should probably be closer to Dylan Bundy’s 28%, which would be closer to the 27% we saw from Castillo last season.
The drop in velo and spin rate scare me to death about a potential looming injury. His walks are slightly up and he appears to have a bit of a home run issue (1.6 xHR/9, up from 0.8 last season) driven by an increase in exit velocity allowed. I’m more inclined to bet on the stickiness of strikeouts and walks over contact allowed. While the potential injury threat is holding me back from calling him a screaming buy, I’m with Eno here and buying if I can get a meaningful draft-day discount.
Mike Clevinger is another preseason darling who hasn’t lived up to expectations so far this season, his K% mysteriously falling from 27% last season to 17% so far this season. Still, he shows as average across all three metrics, suggesting his 17% K% should be at least closer to league average of 21-22%.
With his velo drop, I’ve been selling (or dropping) Kevin Gausman wherever I have him. Talk about a tease. But I wonder if I jumped the gun! He shows as 34th in our metric, but only 66th in actual K%, suggesting his 20.8% K% should be closer to 26%. I’m still not fully buying, but more inclined to give him additional thought after seeing this.
Holy moly, these metrics think Dylan Bundy is underperforming his current 28% K%! How can that be?! The metric here pegs him as 4th best, suggesting his K% should sit closer to Patrick Corbin at 36-37%. As someone who was in on Bundy early last season, it pains me to see my rosters completely devoid of any Bundy shares this season. Buy if you can, but I doubt any owner is selling. Having said that, be watchful if he suddenly stops throwing his slider 25% of the time—something that he mysteriously did last season that coincided with his midseason malaise.
Similar to Bundy, I’ve been an Eduardo Rodriguez advocate over the years, but surprisingly have zero shares this year. Apparently, others were bigger fans than me in my leagues. So far, he’s been a solid, if unspectacular, pitcher—sporting a 3.63 ERA, 4.08 FIP and 16% K-BB%. I might be buying his current numbers, particularly if owners are scared off by his FIP.
While his 24.5% K% is above average, our metric here suggests he should be even better and closer to top 15 around Shohei Ohtani at 31-32%. His SwStr%, Contact% and O-Swing% are all at least one SD above the mean in our sample. Also, it’s not much, but he might be getting slightly unlucky with the long ball (1.2 HR/9 versus 1.1 xHR/9). He has struggled with injuries over the years, particularly the knee, so this could all go up in smoke at any second. But I’m buying if owners see the 4.08 FIP and are a bit scared off.
The last name on the positive side of the ledger. I’ve been infatuated with Zack Godley since he burst onto the scene last season. Sadly, I only got shares in two of my five leagues this year, but he’s someone I’d love to acquire in more. He started the season strong, but has run into issues in recent starts. Still, he holds an above average SwStr% and Contact% and his K% should be closer to 27-28% than his current league average 22.8%. While those metrics are down from last season, I’m currently buying Godley.
Potential Overperformers
Let’s look at the other side of the ledger and discuss some players that are potentially overperforming in strikeouts that could be worth exploring selling.
Steven Matz somehow has a 27% K% despite ranking well below average across the trio of SwStr%, Contact% and O-Swing%. I actually dropped him in a league last week. I doubt anyone is buying, but if someone sees his shiny 27% K% and thinks he might be a useful asset, I’d certainly be willing to sell. This analysis suggests his K% should be roughly half of what it currently is.
Carlos Martinez is an interesting name to see here—I highlighted him as a velocity decliner last week and he shows up poorly on this list as well, below-average across all three metrics. His current 25% K% should probably be closer to league average of 22%. I’m not selling at all costs, but his history of production, pedigree and current 1.43/2.89 ERA/FIP certainly allow you to sell for a nice return if you so choose.
I’d considering shopping Martinez, potentially looking for a return of a lower draft day cost of a pitcher who’s actual value might still be greater than his perceived value (e.g., Patrick Corbin, Bundy, etc.) and use that “downgrade” to grab a substantial hitting upgrade in return.
After writing about Mike Foltynewicz as a velocity surger, now he shows up here as one of the potentially largest strikeout overperfomers!? What language is that!? I need a roadmap! While Folty has a shiny 29% K% right now, he’s not doing anything special across these metrics. And his ranking suggests he should probably be closer to 22%. Either way, given that he was essentially free on draft day, owners shouldn’t worry too much. Still, if people believe this is the breakout they’ve been waiting for, I’d certainly be willing to sell—particularly in that ballpark as the summer heats up.
Oy, as a David Price enthusiast and owner this season, I don’t feel great seeing him so low on this list, especially since he’s only at a paltry 20% K% as is! These stats suggest it should be closer to Brandon McCarthy’s 17%. While his velocity is predictably down having come from the bullpen last season, it is a bit worrisome to see his K% so low.
As Eno Sarris ($) alluded to, Price’s stuff will likely play up due to his effective “tunneling”—essentially some of his pitches look the same to batters, then suddenly break differently once it’s too late for a batter to adjust. I’m holding firm for now, but not proactively buying.
Wrapping Up
A potential project for the future would be to create a more rigorous expected strikeout rate equation (xK%), but for now, this shorthand should directionally point us to outliers. It’s our job to assess whether we believe in that outlier or if it’s worth exploiting in the market, either buying or selling.
If nothing else, remember that we care about strikeouts, walks and home runs for pitchers. In the early going, you’re going to want to pay more attention to strikeouts, as they become meaningful quicker.
Adding another lay on top of that, there are pitch- and swing-level metrics under the hood of strikeout rate that might better tell the story. We’ll see if they help us better predict the future.
Data Dump—Full Raw Data
As of 4/29/18
(Sorted by difference – underperformers to overperformers)
| Name | K% | SwStr% | O-Swing% | Contact% | z_SwStr | z_O-Swing | z_Contact | z_TOTAL | w_z_Rk | K_Rk | Diff |
| Luis Castillo | 18.3% | 13.5% | 31.5% | 71.0% | 1.2 | 0.6 | 1.2 | 7.9 | 21 | 94 | -73 |
| Matt Boyd | 15.2% | 10.3% | 31.5% | 76.9% | 0.0 | 0.6 | 0.1 | 1.0 | 50 | 113 | -63 |
| Mike Fiers | 15.2% | 10.2% | 30.3% | 77.4% | 0.0 | 0.3 | 0.0 | 0.3 | 53 | 113 | -60 |
| Aaron Sanchez | 17.2% | 10.8% | 27.5% | 74.0% | 0.2 | -0.4 | 0.7 | 2.2 | 45 | 104 | -59 |
| Steven Brault | 14.5% | 10.2% | 27.0% | 77.1% | 0.0 | -0.5 | 0.1 | -0.3 | 58 | 117 | -59 |
| Michael Fulmer | 18.0% | 11.4% | 32.0% | 77.1% | 0.4 | 0.7 | 0.1 | 2.2 | 44 | 97 | -53 |
| James Shields | 11.0% | 9.2% | 23.7% | 78.6% | -0.4 | -1.3 | -0.2 | -3.1 | 83 | 125 | -42 |
| Jason Hammel | 12.8% | 8.7% | 34.9% | 82.0% | -0.6 | 1.4 | -0.9 | -2.8 | 80 | 121 | -41 |
| Mike Clevinger | 17.6% | 10.1% | 29.9% | 78.6% | 0.0 | 0.2 | -0.2 | -0.6 | 64 | 102 | -38 |
| Carlos Carrasco | 21.9% | 12.8% | 36.1% | 74.4% | 1.0 | 1.7 | 0.6 | 6.3 | 23 | 59 | -36 |
| Jose Urena | 18.4% | 10.2% | 30.9% | 78.9% | 0.0 | 0.4 | -0.3 | -0.4 | 60 | 93 | -33 |
| Kevin Gausman | 20.8% | 11.9% | 32.1% | 75.5% | 0.6 | 0.7 | 0.4 | 3.7 | 34 | 66 | -32 |
| Alex Wood | 21.4% | 11.5% | 39.1% | 77.6% | 0.5 | 2.4 | 0.0 | 3.8 | 32 | 63 | -31 |
| Mike Minor | 21.4% | 12.3% | 29.6% | 75.1% | 0.8 | 0.1 | 0.4 | 3.8 | 33 | 63 | -30 |
| Eduardo Rodriguez | 24.5% | 14.3% | 34.3% | 71.0% | 1.5 | 1.3 | 1.2 | 9.5 | 12 | 41 | -29 |
| Sonny Gray | 17.3% | 9.3% | 23.2% | 76.7% | -0.3 | -1.5 | 0.1 | -2.0 | 75 | 103 | -28 |
| Zack Godley | 22.8% | 12.0% | 29.6% | 71.2% | 0.7 | 0.1 | 1.2 | 5.7 | 25 | 52 | -27 |
| Matt Moore | 14.8% | 8.6% | 27.9% | 80.3% | -0.6 | -0.3 | -0.5 | -3.7 | 89 | 116 | -27 |
| Jon Lester | 19.1% | 9.8% | 32.2% | 78.7% | -0.1 | 0.7 | -0.2 | -0.4 | 61 | 87 | -26 |
| Masahiro Tanaka | 26.1% | 14.3% | 37.2% | 70.9% | 1.5 | 2.0 | 1.2 | 10.2 | 8 | 33 | -25 |
| Julio Teheran | 22.8% | 11.7% | 31.2% | 71.8% | 0.6 | 0.5 | 1.1 | 5.4 | 27 | 52 | -25 |
| Marco Estrada | 19.7% | 10.9% | 27.7% | 77.7% | 0.3 | -0.4 | 0.0 | 0.3 | 54 | 79 | -25 |
| Tyler Anderson | 24.4% | 13.9% | 27.3% | 70.3% | 1.4 | -0.5 | 1.4 | 7.7 | 22 | 45 | -23 |
| Chris Archer | 24.5% | 14.5% | 31.5% | 72.3% | 1.6 | 0.6 | 1.0 | 8.3 | 18 | 41 | -23 |
| Ivan Nova | 19.6% | 10.0% | 32.6% | 79.4% | -0.1 | 0.8 | -0.4 | -0.5 | 63 | 85 | -22 |
| Jordan Montgomery | 20.4% | 10.3% | 33.8% | 78.1% | 0.0 | 1.1 | -0.1 | 0.9 | 51 | 73 | -22 |
| Zach Davies | 18.3% | 9.1% | 28.1% | 78.1% | -0.4 | -0.3 | -0.1 | -1.8 | 72 | 94 | -22 |
| Tyler Skaggs | 20.7% | 10.5% | 32.3% | 77.0% | 0.1 | 0.8 | 0.1 | 1.4 | 48 | 68 | -20 |
| Dylan Bundy | 28.4% | 15.8% | 37.6% | 69.3% | 2.1 | 2.1 | 1.5 | 12.9 | 4 | 22 | -18 |
| Jake Odorizzi | 19.7% | 10.3% | 26.9% | 77.5% | 0.0 | -0.6 | 0.0 | -0.5 | 62 | 79 | -17 |
| Daniel Mengden | 16.9% | 8.8% | 29.7% | 81.6% | -0.5 | 0.1 | -0.8 | -3.8 | 91 | 107 | -16 |
| Zack Greinke | 26.2% | 13.6% | 34.0% | 71.4% | 1.3 | 1.2 | 1.1 | 8.4 | 17 | 32 | -15 |
| Chad Bettis | 16.8% | 8.2% | 27.9% | 80.1% | -0.7 | -0.3 | -0.5 | -4.0 | 95 | 109 | -14 |
| Lucas Giolito | 8.9% | 7.3% | 21.2% | 80.6% | -1.1 | -1.9 | -0.6 | -6.9 | 112 | 126 | -14 |
| Sean Manaea | 23.6% | 11.4% | 33.4% | 76.2% | 0.4 | 1.0 | 0.2 | 3.1 | 36 | 49 | -13 |
| Kyle Gibson | 26.1% | 13.1% | 31.5% | 70.2% | 1.1 | 0.6 | 1.4 | 7.9 | 20 | 33 | -13 |
| Clayton Richard | 17.7% | 8.7% | 26.7% | 79.9% | -0.6 | -0.6 | -0.5 | -3.6 | 88 | 101 | -13 |
| Michael Wacha | 19.7% | 9.9% | 25.0% | 76.9% | -0.1 | -1.0 | 0.1 | -1.0 | 67 | 79 | -12 |
| Brent Suter | 16.3% | 8.0% | 33.0% | 83.1% | -0.8 | 0.9 | -1.1 | -4.7 | 99 | 111 | -12 |
| Reynaldo Lopez | 19.7% | 9.9% | 24.5% | 77.4% | -0.1 | -1.1 | 0.0 | -1.4 | 69 | 79 | -10 |
| Cole Hamels | 25.3% | 12.1% | 34.1% | 73.6% | 0.7 | 1.2 | 0.7 | 5.5 | 26 | 36 | -10 |
| Jon Gray | 24.5% | 12.4% | 27.6% | 73.2% | 0.8 | -0.4 | 0.8 | 4.5 | 31 | 41 | -10 |
| Mike Leake | 14.9% | 7.5% | 29.8% | 82.8% | -1.0 | 0.2 | -1.0 | -5.9 | 105 | 115 | -10 |
| Aaron Nola | 19.1% | 9.1% | 33.8% | 81.3% | -0.4 | 1.1 | -0.7 | -2.3 | 78 | 87 | -9 |
| Charlie Morton | 29.4% | 14.2% | 29.5% | 67.8% | 1.5 | 0.1 | 1.8 | 10.0 | 10 | 18 | -8 |
| Jacob deGrom | 31.0% | 14.9% | 33.6% | 70.2% | 1.7 | 1.1 | 1.4 | 10.4 | 7 | 15 | -8 |
| Yonny Chirinos | 20.9% | 10.2% | 32.4% | 78.9% | 0.0 | 0.8 | -0.3 | 0.0 | 57 | 65 | -8 |
| Shohei Ohtani | 32.1% | 15.9% | 27.3% | 64.1% | 2.1 | -0.5 | 2.5 | 13.4 | 3 | 11 | -8 |
| Francisco Liriano | 18.0% | 8.3% | 27.5% | 79.6% | -0.7 | -0.4 | -0.4 | -3.7 | 90 | 97 | -7 |
| Jarlin Garcia | 20.0% | 9.2% | 27.0% | 77.3% | -0.4 | -0.5 | 0.0 | -1.5 | 71 | 77 | -6 |
| Trevor Bauer | 24.5% | 11.4% | 32.2% | 75.3% | 0.4 | 0.7 | 0.4 | 3.3 | 35 | 41 | -6 |
| Marcus Stroman | 20.5% | 9.3% | 25.2% | 75.4% | -0.3 | -1.0 | 0.4 | -0.8 | 66 | 71 | -5 |
| Chris Sale | 32.6% | 15.4% | 34.8% | 68.3% | 1.9 | 1.4 | 1.7 | 12.3 | 5 | 9 | -4 |
| Blake Snell | 29.9% | 13.8% | 29.8% | 68.7% | 1.3 | 0.2 | 1.7 | 9.1 | 14 | 17 | -3 |
| Miles Mikolas | 20.5% | 9.1% | 39.5% | 82.0% | -0.4 | 2.5 | -0.9 | -1.3 | 68 | 71 | -3 |
| Lance McCullers Jr. | 31.7% | 14.1% | 32.1% | 68.4% | 1.4 | 0.7 | 1.7 | 10.2 | 9 | 12 | -3 |
| Homer Bailey | 14.4% | 7.2% | 29.2% | 84.9% | -1.1 | 0.0 | -1.4 | -7.5 | 115 | 118 | -3 |
| Dillon Peters | 14.4% | 7.2% | 24.0% | 82.8% | -1.1 | -1.3 | -1.0 | -7.6 | 116 | 118 | -2 |
| Patrick Corbin | 36.7% | 16.6% | 37.1% | 63.6% | 2.4 | 1.9 | 2.6 | 16.9 | 2 | 3 | -1 |
| Noah Syndergaard | 32.9% | 15.2% | 36.8% | 69.4% | 1.8 | 1.9 | 1.5 | 12.0 | 6 | 7 | -1 |
| Jhoulys Chacin | 14.1% | 6.7% | 25.3% | 84.2% | -1.3 | -0.9 | -1.3 | -8.6 | 119 | 120 | -1 |
| Ty Blach | 11.7% | 5.8% | 25.7% | 86.3% | -1.6 | -0.8 | -1.7 | -10.7 | 122 | 123 | -1 |
| Chris Tillman | 11.3% | 5.8% | 24.6% | 86.3% | -1.6 | -1.1 | -1.7 | -11.0 | 123 | 124 | -1 |
| Max Scherzer | 38.0% | 18.2% | 35.2% | 64.8% | 3.0 | 1.5 | 2.4 | 17.5 | 1 | 1 | 0 |
| Joey Lucchesi | 26.9% | 11.9% | 28.7% | 71.6% | 0.6 | -0.1 | 1.1 | 5.1 | 28 | 28 | 0 |
| Gio Gonzalez | 24.2% | 10.4% | 29.6% | 75.5% | 0.1 | 0.1 | 0.4 | 1.4 | 47 | 47 | 0 |
| Bryan Mitchell | 7.7% | 4.0% | 18.4% | 90.1% | -2.3 | -2.6 | -2.4 | -16.7 | 127 | 127 | 0 |
| Johnny Cueto | 22.2% | 10.3% | 26.4% | 77.1% | 0.0 | -0.7 | 0.1 | -0.4 | 59 | 57 | 2 |
| Jake Faria | 20.2% | 9.3% | 23.9% | 77.4% | -0.3 | -1.3 | 0.0 | -2.2 | 77 | 75 | 2 |
| Jakob Junis | 19.7% | 9.0% | 30.2% | 80.7% | -0.4 | 0.3 | -0.6 | -2.9 | 82 | 79 | 3 |
| Bartolo Colon | 17.8% | 7.9% | 30.2% | 83.5% | -0.9 | 0.3 | -1.1 | -5.7 | 103 | 99 | 4 |
| Sal Romano | 12.4% | 4.5% | 25.9% | 89.2% | -2.1 | -0.8 | -2.2 | -13.8 | 126 | 122 | 4 |
| Justin Verlander | 32.4% | 14.0% | 34.6% | 71.6% | 1.4 | 1.3 | 1.1 | 8.9 | 15 | 10 | 5 |
| Dallas Keuchel | 18.3% | 8.1% | 28.1% | 81.6% | -0.8 | -0.3 | -0.8 | -4.9 | 100 | 94 | 6 |
| Kendall Graveman | 17.2% | 7.1% | 27.9% | 82.3% | -1.1 | -0.3 | -0.9 | -6.5 | 111 | 104 | 7 |
| Kenta Maeda | 33.7% | 14.4% | 32.1% | 70.8% | 1.6 | 0.7 | 1.3 | 9.2 | 13 | 5 | 8 |
| Luis Severino | 29.2% | 12.3% | 30.5% | 73.7% | 0.8 | 0.3 | 0.7 | 4.8 | 29 | 20 | 9 |
| Clayton Kershaw | 26.9% | 12.0% | 31.3% | 76.5% | 0.7 | 0.5 | 0.2 | 3.1 | 37 | 28 | 9 |
| Gerrit Cole | 38.0% | 14.8% | 30.1% | 69.4% | 1.7 | 0.2 | 1.5 | 9.9 | 11 | 1 | 10 |
| Chase Anderson | 16.9% | 7.1% | 25.7% | 84.0% | -1.1 | -0.8 | -1.2 | -8.0 | 117 | 107 | 10 |
| J.A. Happ | 33.6% | 14.1% | 30.7% | 70.8% | 1.4 | 0.4 | 1.3 | 8.5 | 16 | 6 | 10 |
| Trevor Williams | 16.4% | 6.1% | 26.3% | 85.5% | -1.5 | -0.7 | -1.5 | -9.8 | 121 | 110 | 11 |
| Tyler Mahle | 27.0% | 11.6% | 29.1% | 74.8% | 0.5 | 0.0 | 0.5 | 3.0 | 38 | 27 | 11 |
| Carson Fulmer | 15.8% | 5.7% | 22.6% | 85.6% | -1.7 | -1.6 | -1.5 | -11.2 | 124 | 112 | 12 |
| Nick Pivetta | 25.4% | 11.0% | 30.8% | 77.5% | 0.3 | 0.4 | 0.0 | 1.3 | 49 | 35 | 14 |
| Stephen Strasburg | 26.9% | 11.2% | 31.9% | 76.5% | 0.4 | 0.7 | 0.2 | 2.3 | 42 | 28 | 14 |
| Tanner Roark | 22.6% | 9.5% | 31.5% | 79.7% | -0.3 | 0.6 | -0.4 | -1.5 | 70 | 55 | 15 |
| Luke Weaver | 21.6% | 9.8% | 23.3% | 77.8% | -0.1 | -1.4 | -0.1 | -2.1 | 76 | 61 | 15 |
| Felix Hernandez | 18.6% | 7.4% | 28.9% | 82.5% | -1.0 | -0.1 | -1.0 | -6.0 | 107 | 92 | 15 |
| Robbie Ray | 36.1% | 13.1% | 26.5% | 67.7% | 1.1 | -0.7 | 1.8 | 8.1 | 19 | 4 | 15 |
| Danny Duffy | 19.7% | 8.6% | 29.2% | 81.3% | -0.6 | 0.0 | -0.7 | -3.9 | 94 | 79 | 15 |
| Matt Harvey | 17.8% | 7.7% | 22.5% | 82.9% | -0.9 | -1.6 | -1.0 | -7.5 | 114 | 99 | 15 |
| Caleb Smith | 32.7% | 13.0% | 30.7% | 72.6% | 1.0 | 0.4 | 0.9 | 6.2 | 24 | 8 | 16 |
| Jake Arrieta | 18.8% | 7.1% | 33.0% | 84.1% | -1.1 | 0.9 | -1.3 | -6.3 | 108 | 91 | 17 |
| James Paxton | 31.2% | 12.9% | 26.9% | 73.7% | 1.0 | -0.6 | 0.7 | 4.6 | 30 | 13 | 17 |
| Kyle Hendricks | 19.5% | 7.5% | 26.5% | 81.3% | -1.0 | -0.7 | -0.7 | -5.8 | 104 | 86 | 18 |
| Tyson Ross | 25.2% | 9.6% | 29.9% | 76.4% | -0.2 | 0.2 | 0.2 | 0.1 | 56 | 38 | 18 |
| Brandon McCarthy | 17.1% | 5.7% | 21.8% | 87.0% | -1.7 | -1.8 | -1.8 | -12.2 | 125 | 106 | 19 |
| Jose Quintana | 19.8% | 8.3% | 26.5% | 80.5% | -0.7 | -0.7 | -0.6 | -4.5 | 97 | 78 | 19 |
| Corey Kluber | 28.1% | 11.0% | 31.8% | 76.2% | 0.3 | 0.6 | 0.2 | 2.3 | 43 | 23 | 20 |
| Garrett Richards | 29.1% | 10.8% | 25.1% | 72.4% | 0.2 | -1.0 | 1.0 | 2.5 | 41 | 21 | 20 |
| Vince Velasquez | 26.8% | 10.8% | 27.4% | 76.6% | 0.2 | -0.4 | 0.2 | 0.7 | 52 | 31 | 21 |
| Jameson Taillon | 22.2% | 8.8% | 30.7% | 79.8% | -0.5 | 0.4 | -0.4 | -2.5 | 79 | 57 | 22 |
| Ben Lively | 19.1% | 7.9% | 22.1% | 81.1% | -0.9 | -1.7 | -0.7 | -6.3 | 109 | 87 | 22 |
| Ian Kennedy | 19.1% | 7.5% | 31.2% | 84.5% | -1.0 | 0.5 | -1.3 | -6.5 | 110 | 87 | 23 |
| Chris Stratton | 20.2% | 8.4% | 25.8% | 80.6% | -0.7 | -0.8 | -0.6 | -4.6 | 98 | 75 | 23 |
| Sean Newcomb | 28.1% | 10.9% | 27.0% | 74.4% | 0.3 | -0.5 | 0.6 | 2.0 | 46 | 23 | 23 |
| Jose Berrios | 30.0% | 11.3% | 33.5% | 77.0% | 0.4 | 1.1 | 0.1 | 2.5 | 40 | 16 | 24 |
| Kyle Freeland | 21.7% | 8.6% | 28.9% | 79.7% | -0.6 | -0.1 | -0.4 | -3.1 | 85 | 60 | 25 |
| Hyun-Jin Ryu | 31.2% | 11.2% | 26.3% | 72.9% | 0.4 | -0.7 | 0.9 | 3.0 | 39 | 13 | 26 |
| German Marquez | 20.8% | 8.9% | 27.2% | 80.9% | -0.5 | -0.5 | -0.6 | -3.9 | 92 | 66 | 26 |
| Chad Kuhl | 20.7% | 8.8% | 22.3% | 79.0% | -0.5 | -1.7 | -0.3 | -4.1 | 96 | 68 | 28 |
| Trevor Richards | 22.4% | 8.9% | 26.9% | 79.4% | -0.5 | -0.6 | -0.4 | -3.1 | 84 | 56 | 28 |
| David Price | 20.3% | 7.8% | 29.4% | 83.3% | -0.9 | 0.1 | -1.1 | -5.9 | 106 | 74 | 32 |
| Yu Darvish | 25.0% | 9.4% | 26.9% | 78.2% | -0.3 | -0.6 | -0.1 | -1.9 | 73 | 39 | 34 |
| Eric Skoglund | 20.7% | 7.6% | 33.0% | 83.5% | -1.0 | 0.9 | -1.1 | -5.4 | 102 | 68 | 34 |
| Rick Porcello | 25.0% | 9.3% | 33.6% | 81.0% | -0.3 | 1.1 | -0.7 | -1.9 | 74 | 39 | 35 |
| Andrew Triggs | 22.8% | 8.2% | 31.1% | 80.8% | -0.7 | 0.5 | -0.6 | -3.6 | 87 | 52 | 35 |
| Mike Foltynewicz | 29.3% | 10.2% | 25.3% | 75.3% | 0.0 | -0.9 | 0.4 | 0.3 | 55 | 19 | 36 |
| Marco Gonzales | 27.6% | 9.7% | 32.1% | 79.1% | -0.2 | 0.7 | -0.3 | -0.8 | 65 | 25 | 40 |
| Jaime Garcia | 24.4% | 8.7% | 26.0% | 78.8% | -0.6 | -0.8 | -0.3 | -3.2 | 86 | 45 | 41 |
| Tyler Chatwood | 23.5% | 8.4% | 25.2% | 79.1% | -0.7 | -1.0 | -0.3 | -3.9 | 93 | 51 | 42 |
| Carlos Martinez | 25.3% | 9.0% | 28.4% | 79.9% | -0.4 | -0.2 | -0.5 | -2.9 | 81 | 36 | 45 |
| Andrew Cashner | 21.5% | 7.3% | 25.9% | 82.9% | -1.1 | -0.8 | -1.0 | -7.1 | 113 | 62 | 51 |
| Junior Guerra | 23.9% | 8.5% | 24.5% | 81.1% | -0.6 | -1.1 | -0.7 | -5.1 | 101 | 48 | 53 |
| Derek Holland | 23.6% | 6.6% | 23.5% | 85.0% | -1.3 | -1.4 | -1.4 | -9.6 | 120 | 49 | 71 |
| Steven Matz | 27.4% | 7.3% | 19.1% | 81.8% | -1.1 | -2.5 | -0.8 | -8.1 | 118 | 26 | 92 |


