Prognosis Negative: Early Pitching Velocity Decliners

 The baseball season is just three weeks in and there are still a lot of games left to play. That’s a lot of statistics yet to accumulate for your fantasy baseball team.
Around this time of the year, there are always some pretty wild fluctuations in player numbers. But it’s not too soon to start looking at early-season stats that matter and which players stand out the most – for better or for worse.
Last week we discussed that velocity is among the first things to look at with pitchers. After all, velocity may become meaningful in as few as 10 fastballs. Many starters have thrown 10-20x that, while many relievers have thrown 5x (or more) the 10 fastball threshold.
So What?
Even if it does indeed become meaningful faster, why does a pitcher’s velocity even matter? Can anyone really even tell the difference between 94 and 95 mph?
Many of you play in rotisserie leagues, and outside of the most bizarre league setups, no one is using fastball velocity as a scoring measure. But wait, research done by The Hardball Times has suggested that each tick lost in velocity results in more runs allowed – now we’re hitting you where it hurts!
In fact, the study found that every tick lost for starting pitchers tacks on roughly 0.25 of ERA. It’s more stark for relievers, who’s ERA gets worse by 0.40-0.45 for every tick lost. Hard-throwing pitchers who rely more on their velocity for success – often younger pitchers – are adversely affected the most.
This intuitively makes sense, as relievers tend to rely more on their fastball, and thus velocity, while younger, flamethrowing starters may not have yet flushed out the rest of their arsenal and need the velocity for their repertoire to play up.
Having said that, we don’t want to panic too much – after all, velocity peaks in August. Even so, pitchers tend to gain only one tick (at best) as the year goes on. If they’re down more than one tick in April, it’s fairly bettable they’ll be down on the year.
So, who’s down on the year!? Many sites are beating this to death, but velocity is one of the most meaningful indicators early on, so let’s go for a refresh. The data below is courtesy of Fangraphs as of 4/18 (minimum 10 fastballs).
Biggest Decliners
Top 20 Decliners – Starting Pitchers
| # | Name | IP | Fastballs | FBv_18 | FBv_17 | Diff |
| 1 | Matt Boyd | 13 | 86 | 88.8 | 92 | -3.2 |
| 2 | JC Ramirez | 6.2 | 63 | 92.6 | 95.5 | -2.9 |
| 3 | Kevin Gausman | 15 | 166 | 92.3 | 95 | -2.7 |
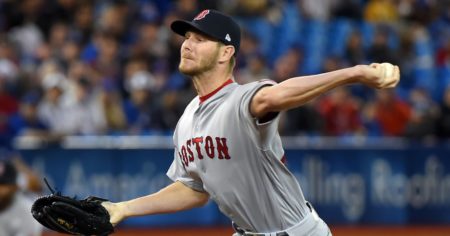
| 4 | Chris Sale | 22 | 238 | 91.8 | 94.4 | -2.6 |
| 5 | Jarlin Garcia | 21 | 182 | 91.7 | 94.2 | -2.5 |
| 6 | Mike Minor | 15.2 | 124 | 92 | 94.4 | -2.4 |
| 7 | Jhoulys Chacin | 17.2 | 174 | 89.1 | 91.4 | -2.3 |
| 8 | Mike Fiers | 11.2 | 91 | 87.5 | 89.7 | -2.2 |
| 9 | Brandon McCarthy | 16.1 | 118 | 90.9 | 93.1 | -2.2 |
| 10 | Michael Wacha | 14.2 | 133 | 92.9 | 95.1 | -2.2 |
| 11 | Julio Teheran | 20 | 209 | 89.3 | 91.4 | -2.1 |
| 12 | Trevor Williams | 23.1 | 267 | 90 | 92.1 | -2.1 |
| 13 | David Price | 20 | 134 | 92.2 | 94.3 | -2.1 |
| 14 | Zack Greinke | 17 | 123 | 88.9 | 91 | -2.1 |
| 15 | Alex Wood | 23 | 125 | 89.8 | 91.8 | -2.0 |
| 16 | Cole Hamels | 22 | 139 | 90 | 92 | -2.0 |
| 17 | Luis Castillo | 22.2 | 231 | 95.5 | 97.5 | -2.0 |
| 18 | Carlos Martinez | 25.2 | 187 | 93.7 | 95.6 | -1.9 |
| 19 | Robbie Ray | 15.2 | 135 | 92.4 | 94.3 | -1.9 |
| 20 | Jaime Garcia | 16.1 | 162 | 88.9 | 90.7 | -1.8 |
Not that many are relying on him, but Matt Boyd also appears on the top of Jeff Zimmerman’s injury finder tool. Some in deeper leagues were eyeing him and Daniel Norris as arms of intrigue, but that ship may have sailed.
Second on the list, JC Ramirez has already been designated for Tommy John surgery and he’ll miss the rest of the season.
As someone who liked Kevin Gausman going into the season, I don’t feel great about seeing his name so high on the list. At this time last season, he was averaging 95.3 on his fastball, and those still hoping for a breakout – like Tristan Cockroft – may need to reassess.
Chris Sale is the first truly interesting name on this list, down 2.6 ticks from last season. He’s still been killing it early on with a 36% strikeout rate. However, if we assume he’s down even just 1.5 ticks from last season, perhaps he’s closer to a 3.30 ERA pitcher than his 2.90 ERA last season. Nothing to worry too much about, but not quite the same level you’d expect from the “elite four” as they were being touted during draft season (along with Kershaw, Scherzer, and Kluber).
Nothing much to see with Mike Minor, as he’s shifting back into the rotation after spending the last couple seasons in the bullpen. His current velo is actually a bit higher than the 91 he was throwing last time in the rotation back in 2014. Same goes for David Price, who pitched out of the bullpen last season, but was at roughly 93 in his 2016 run as a starter.
The arms that might draw more concern are towards the bottom of the list – an interesting collection to be certain: Zack Greinke, Alex Wood, Luis Castillo, Carlos Martinez, and Robbie Ray. It’s scary to see Greinke go Jered Weaver on our asses, but he might be the best suited among this group to deal with a velocity drop. His current 27.8% K-BB% might suggest he’s figuring it out.
Consistent with The Hardball Times study, the other younger, harder-throwing pitchers may have more cause for concern.
Alex Wood‘s velo dropped each month last season and, while some chalked it up to a tired young arm who pitched only 60 innings the season before, his K-BB% and FIP worsened each month in conjunction with the velo drop. He’s up about a tick up from where he ended last season, but he’s certainly someone worth monitoring closely.
Same goes for Luis Castillo, another young flame-throwing arm that took the league by storm last season. I’m not sure who to believe here as Brooks Baseball has him at 96, which would still represent 1.5 ticks lost. He might have one of the best changeups in the game, but if his velocity is down even just a tick, he might be closer to a 4.00 ERA pitcher than his 3.74 FIP last season.
Carlos Martinez and Robbie Ray are two more really interesting arms, both certainly drafted as top 15-20 starting pitchers this draft season. Ray in particular stands out, as it felt like he always flirted with danger more than your prototypical perceived fantasy ace, between the high walks and hard contact allowed. Oddly enough, his FIPs were nearly identical the last two seasons, between 3.72-3.76, despite the wildly differing results (4.90 ERA in 2016, 2.89 in 2017).
His true talent is probably closer to his last two year’s FIPs than to last season’s 2.89 ERA, but the humidor might help shave some runs. Even so, if someone was trying to buy low from me thinking they’re still getting a sub-3.20-type ace, I might pull the trigger. Then again, I don’t have any shares this season.
As for Martinez, like with Castillo, Brooks actually has him closer to 95. I don’t think I’d be too worried about Carlos yet.
Top 20 Decliners – Relief Pitchers
| # | Name | IP | Fastballs | FBv_18 | FBv_17 | Diff |
| 1 | Daniel Norris | 6.1 | 47 | 90.1 | 93.2 | -3.1 |
| 2 | Tommy Kahnle | 7.1 | 67 | 95 | 97.9 | -2.9 |
| 3 | Enny Romero | 2 | 45 | 95.4 | 98 | -2.6 |
| 4 | Liam Hendriks | 3 | 47 | 92.2 | 94.7 | -2.5 |
| 5 | Jose Ramirez | 6.1 | 98 | 94.6 | 97.1 | -2.5 |
| 6 | Raisel Iglesias | 7.1 | 55 | 94 | 96.4 | -2.4 |
| 7 | Craig Kimbrel | 7 | 77 | 95.9 | 98.3 | -2.4 |
| 8 | Sam Dyson | 6.1 | 51 | 92.7 | 95.1 | -2.4 |
| 9 | Gregory Infante | 4.1 | 71 | 93.2 | 95.5 | -2.3 |
| 10 | Brad Brach | 7.2 | 87 | 92.8 | 95 | -2.2 |
| 11 | Juan Nicasio | 8.2 | 110 | 93.2 | 95.4 | -2.2 |
| 12 | Jake McGee | 8.1 | 91 | 92.8 | 94.9 | -2.1 |
| 13 | Alex Claudio | 8 | 64 | 84.6 | 86.7 | -2.1 |
| 14 | Tony Watson | 7.2 | 74 | 91.5 | 93.6 | -2.1 |
| 15 | Wade LeBlanc | 5 | 32 | 85.2 | 87.3 | -2.1 |
| 16 | Josh Smoker | 4 | 55 | 92.5 | 94.6 | -2.1 |
| 17 | Kenley Jansen | 6.2 | 117 | 91.3 | 93.3 | -2 |
| 18 | Yovani Gallardo | 2.1 | 39 | 90.2 | 92.2 | -2 |
| 19 | Josh Fields | 9 | 101 | 93.5 | 95.4 | -1.9 |
| 20 | Seung Hwan Oh | 7 | 74 | 91 | 92.9 | -1.9 |
As we discussed earlier, velocity is an even bigger deal for relievers, who invariably have a smaller margin for error given their smaller arsenals and greater reliance on the fastball – that’s largely why they ended up in the bullpen in the first place!
I’m only going to touch on the really interesting names here – namely closers or adjacent closers – but the first two names caught my eye. I find it odd that Daniel Norris – after moving from a starter to the pen – has somehow lost three ticks off his fastball. I actually grabbed a share of him in one of my 50-round NFBC draft-and-stash leagues, but I won’t be holding my breath for much production this season.
Meanwhile, Tommy Kahnle was one of the better relief stories last season, seemingly coming out of nowhere to post the 10th best WAR among relief pitchers. Jeff Sullivan credited his overpowering fastball as a huge piece of his success last season, and it’s fair to wonder if we’ll get the same elite Kahnle this season. Zimmerman’s injury tool rates him among the higher injury risks as well, and he’s certainly lost some luster in holds leagues.
Going down the list, fantasy owners don’t want to see Craig Kimbrel’s name here. Worse, he rates among the highest injury risks based on Zimmerman’s injury tool. The results have been there so far this season (0 earned runs), but his K-BB% is down from an elite 44.1% to a more pedestrian (for a reliever like Kimbrel) 23.1% so far this season (in 7 innings, to be fair).
Like Kenley Jansen lower on the list, I don’t want to overreact, but I also may be more biased with closers, who I don’t believe to be a great investment in traditional 5×5 fantasy formats.But, man, what the hell is going on!? Velo is down, and his K-BB% currently sits at 12.9% (was 36%, 37%, and 39.5% in 2015, 2016, and 2017). It’s early – the guy has pitched 6.2 innings!
If there’s a way I can sell at cost while keeping my saves situation intact – much easier said than done, I know – than I’d strongly lean towards flipping these guys.
It’s a bit concerning to see Raisel Iglesias here, although his K-BB% results haven’t suffered much in his 7.1 innings pitched. Brad Brach hasn’t been terrible so far, but he also shows up high on Zimmerman’s injury tool. Unfortunately, not many are likely to be buying Brach, but I’m happy to sell if someone thinks they have a half-decent closer on their hands.
Lastly, I wouldn’t pay too much attention to Josh Fields, but it could be relevant in the event that there is something off with Jansen. While Fields is likely the next man up should Jansen need to miss time, don’t completely forget the name Pedro Baez, who could figure into the situation.
Concluding Thoughts
While velocity isn’t everything, it will have an impact on results we care about. Worse, velocity decline can be a potential indicator of injury. Make sure you do your due diligence on these velocity decliners, and be prepared to take advantage of selling opportunities if their updated projections looks like it’s worth less than market perception.
Remember that each tick lost in velocity adds about 0.25 ERA to starters and 0.40-0.45 ERA to relievers, and that each pitcher is likely to only gain one tick as the season goes on. It’s dangerous – that’s right, I am dangerous! – to project more.
In our next piece, we’ll take a quick look at a select few velocity surgers, and then to changes in pitch mix. As the season progresses, we’ll continue to use our stats to look at piece to guide our thinking and analysis. Stay tuned!